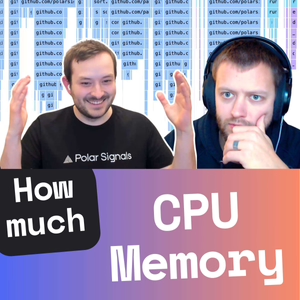
How much CPU & Memory?
02/29/24 • 35 min
This episode looks into the observability tool Parca & Polar Signals Cloud with Frederic Branczyk and Thor Hansen. We discuss experiences and discoveries using Parca for detailed system-wide performance analysis, which transcends programming languages.
We highlight a significant discovery related to kube-prometheus and the unnecessary CPU usage caused by Prometheus exporter's attempts to access BTRFS stats, leading to a beneficial configuration change for Kubernetes users globally.
We also explore Parca Agent's installation on Kubernetes 1.28 running on Talos 1.5, the process of capturing memory profiles with Parca, and the efficiency of the Parca Agent in terms of memory and CPU usage.
We touch upon the continuous operation of the Parca Agent, the importance of profiling for debugging and optimization, and the potential of profile-guided optimizations in Go 1.22 for enhancing software efficiency.
🎬 Screensharing videos that go with this episode:
- First impressions: Parca Agent on K8s 1.28 running as Talos 1.5
- See where your Go code allocates memory
- How to debug a memory issue with Parca?
- See which line of your Go code allocates the most memory
🎁 Access the audio & all videos as a single conversation at makeitwork.gerhard.io
LINKS
- Go Profile-guided optimization
- View Profiling Data within Code
- Announcing Continuous Memory Profiling for Rust
EPISODE CHAPTERS
- (00:00) - Intro
- (02:21) - kube-prometheus discovery & fix
- (06:29) - Parca Agent on K8s 1.28 running as Talos 1.5
- (06:49) - How to capture memory profiles with Parca?
- (08:42) - pprof.me
- (10:42) - Data retention in Parca
- (11:42) - A real-world memory issue debugging example
- (16:05) - How much memory is Parca Server expected to use?
- (17:39) - How much memory is the Parca Agent expected to use?
- (19:42) - What about Parca Agent CPU usage?
- (21:57) - Is Parca Agent meant to run continously?
- (23:03) - Other Parca stories worth sharing
- (25:19) - What are the things that you are looking forward to in 2024?
- (27:23) - Golang Profile Guided Optimisations with Parca
- (30:22) - Frederic's surprise screen share
- (34:02) - Wrap-up
Next Episode

Automation Engine
Today we delve into BuildKit and Dagger, focusing on their significance in the development and deployment of containerized applications, as well as Kubernetes integration.
- BuildKit's Role: Essential for anyone using Docker Build, facilitating efficient, dependency-aware container builds with advanced caching mechanisms. It's not just for Docker but serves as a versatile execution engine across various projects, including Dagger.
- Eric's Attraction to BuildKit: The power of BuildKit's DAG (Directed Acyclic Graph) execution model and its parallelization and deduplication capabilities drew Eric to maintain and contribute to the project.
- First BuildKit Project: Eric's initial project, bincastle, aimed to build a development environment from source, highlighting BuildKit's ability to handle complex builds.
- Introduction of Dagger: Dagger builds on top of BuildKit, enhances automation by allowing developers to use familiar programming languages without being confined to a specific domain-specific language (DSL). It aims to simplify and optimize automation tasks, particularly in CI/CD environments.
- Dagger's Enhancements over BuildKit: Dagger introduces a language-agnostic layer, making automation more accessible and scalable. It incorporates features like remote caching and a services layer, potentially positioning it as a simpler alternative to Kubernetes for certain use cases.
- Future Directions: The podcast touches on ongoing developments, such as modules for sharing automation code within Dagger, aiming to foster an ecosystem where developers can easily reuse and contribute to collective automation solutions.
The conversation highlights the evolving landscape of development tools, where BuildKit and Dagger play pivotal roles in making containerized development and deployment more efficient and user-friendly. Eric and Gerhard discuss the potential for these tools to simplify and enhance automation, reflecting on past projects and future possibilities.
🎬 View the video part of this episode: Deploying and Experimenting with Dagger 0.9 on Kubernetes 1.28
🎁 Access the audio & video as a single conversation at makeitwork.gerhard.io
LINKS
dagger --mod github.com/sipsma/daggerverse/yamlinvaders@8071646e5831d7c93ebcd8cca46444250bf25b8c shell play
EPISODE CHAPTERS
- (00:00) - Intro
- (01:43) - What attracted you to BuildKit?
- (03:23) - What was the first project that you used BuildKit for?
- (06:03) - Four years later, do you still want to see that idea through?
- (06:44) - What is Dagger?
- (08:18) - How much does Dagger add on top of BuildKit?
- (10:42) - How does Gerhard think of Dagger in relation to BuildKit?
- (12:48) - Dagger Modules - a way to share automation code
- (14:01) - If someone installs Dagger today, what happens under the hood?
- (14:47) - Why is the Engine distributed as a container image?
- (16:02) - If the Dagger Engine was a single binary, how would you run it?
- (17:05) - Thoughts on BuildKit caching?
- (18:15) - What about remote caching?
- (20:53) - Let's run Dagger on K8s on this Latte Panda Sigma
- (21:43) - SCREEN SHARE
- (22:06) - As we approach KubeCon, what is on your list?
- (23:19) - An idea for next time when we get together
If you like this episode you’ll love
Episode Comments
Generate a badge
Get a badge for your website that links back to this episode
<a href="https://goodpods.com/podcasts/make-it-work-340598/how-much-cpu-and-memory-49592765"> <img src="https://storage.googleapis.com/goodpods-images-bucket/badges/generic-badge-1.svg" alt="listen to how much cpu & memory? on goodpods" style="width: 225px" /> </a>
Copy


