Three Advertising Maps
05/19/21 • 44 min
Links
Wonderground Map of London [2:47]
Silicon Valley 1991 [15:35]
TAM Cargo Series [31:38]
Wonderground Map of London
Here we have a cartoon map with a black and white chevron pattern that forms the map border. You might think a heavy black and white chevron pattern would overwhelm a map but this doesn’t because there is otherwise so much information throughout the composition that it doesn’t out-compete. This is an example of maximalism, which is definitely not how Vanessa decorates her home.
What is it advertising though? London’s Underground metro system! You’re essentially getting an advertisement of London itself, showing you what you could do in London, and the Underground is how you would get to all those interesting places. In 1914, when this was made, people weren’t really using the Underground on the weekends, it had a reputation for being crowded and dirty, and this map was supposed to--get ready for it--elevate the Underground. Underground stations are named inside blue ribbons. This isn’t a tourist map, it’s for people who already live there as exemplified by the text bubbles highlighting inside jokes that you might not understand if you weren’t a resident. Is there really a dragon in the middle of London? We wonder.
The map artist is MacDonald Gill. We both made a special point of noticing that this map is almost like Where’s Waldo but better! It’s better because you are exploring it in a way that makes you keep looking for more fun things even after you’ve found one or two, and also because it makes you interested in visiting these places in person. The color scheme is yellow and blue with a little red, the black outlining along the Thames River is quite bold but that’s okay because it fits in with the rest of the colorful boldness. What is not on top of the visual hierarchy is the white roofed buildings, instead they form a pattern, but they don’t stand out a lot. In this way the roofs create visual texture and are functional without being overbearing. There is more detail on the salient landmarks though, so those can standout a little more if you look closely.
We philosophize over the fact that time is nothing. Back to the map, we point out some of the inside jokes that we don’t understand. There should be one of these with inside jokes for today for every location. Vanessa wants to go to London now, even in 2021, so the advertising worked!
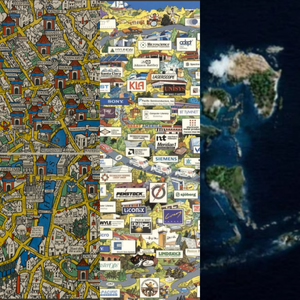
Silicon Valley 1991
Here’s another pictorial map. This one might not make us want to visit there but it does definitely feel advertise-y. The map is cool and pretty with a lot of textures that make it a bit painterly, with visible brush strokes and pen strokes. The map presents a perspective as though you are in the depths of the valley. The vanishing point is directly in front of the figures at the bottom, but the perspective and pitch of the map changes such that you feel that the roads are dipping and undulating, giving the distinct impression of hills that are going upward toward the top of the map. The large hot air balloon and plane are at the top and provide depth and perspective.
We wonder if the map maker, Jill Amen, created the map first and then placed the ads on top, and if so, we’d like to see it without all the ads. Each of the organizations shown on the map paid to get their adverts on it. This kind of advertising happens today in our digital maps as well, where a company pays to be on the map with a unique icon or label. The billboard-like advertisements are blocking our view of the basemap! We are glad that the nice San Francisco landmarks are not covered up at the top. By the way, maps like this are still being made today, search for Silicon Valley Map to find more from the same company.
A map called Silicon Valley in 1982 has a similar perspective and is also a pictorial so we wonder how it relates to this and if it was an inspiration for it. There was definitely social commentary associated with the Silicon Valley in 1982 map so we wonder whether this one might have an element of that as well. There are a lot of nods to the technology and science industries, more landmarks, a budget sign tied to a rock near the bay, and maybe a reference to Berkeley being off in the distance, though we aren’t completely sure. Diversity in the technology industry, or rather, its lack of it, is brought up here. Are companies today taking diversity seriously? Were they then?
TAM Cargo Series
“Anything to Anywhere” is the...
Links
Wonderground Map of London [2:47]
Silicon Valley 1991 [15:35]
TAM Cargo Series [31:38]
Wonderground Map of London
Here we have a cartoon map with a black and white chevron pattern that forms the map border. You might think a heavy black and white chevron pattern would overwhelm a map but this doesn’t because there is otherwise so much information throughout the composition that it doesn’t out-compete. This is an example of maximalism, which is definitely not how Vanessa decorates her home.
What is it advertising though? London’s Underground metro system! You’re essentially getting an advertisement of London itself, showing you what you could do in London, and the Underground is how you would get to all those interesting places. In 1914, when this was made, people weren’t really using the Underground on the weekends, it had a reputation for being crowded and dirty, and this map was supposed to--get ready for it--elevate the Underground. Underground stations are named inside blue ribbons. This isn’t a tourist map, it’s for people who already live there as exemplified by the text bubbles highlighting inside jokes that you might not understand if you weren’t a resident. Is there really a dragon in the middle of London? We wonder.
The map artist is MacDonald Gill. We both made a special point of noticing that this map is almost like Where’s Waldo but better! It’s better because you are exploring it in a way that makes you keep looking for more fun things even after you’ve found one or two, and also because it makes you interested in visiting these places in person. The color scheme is yellow and blue with a little red, the black outlining along the Thames River is quite bold but that’s okay because it fits in with the rest of the colorful boldness. What is not on top of the visual hierarchy is the white roofed buildings, instead they form a pattern, but they don’t stand out a lot. In this way the roofs create visual texture and are functional without being overbearing. There is more detail on the salient landmarks though, so those can standout a little more if you look closely.
We philosophize over the fact that time is nothing. Back to the map, we point out some of the inside jokes that we don’t understand. There should be one of these with inside jokes for today for every location. Vanessa wants to go to London now, even in 2021, so the advertising worked!
Silicon Valley 1991
Here’s another pictorial map. This one might not make us want to visit there but it does definitely feel advertise-y. The map is cool and pretty with a lot of textures that make it a bit painterly, with visible brush strokes and pen strokes. The map presents a perspective as though you are in the depths of the valley. The vanishing point is directly in front of the figures at the bottom, but the perspective and pitch of the map changes such that you feel that the roads are dipping and undulating, giving the distinct impression of hills that are going upward toward the top of the map. The large hot air balloon and plane are at the top and provide depth and perspective.
We wonder if the map maker, Jill Amen, created the map first and then placed the ads on top, and if so, we’d like to see it without all the ads. Each of the organizations shown on the map paid to get their adverts on it. This kind of advertising happens today in our digital maps as well, where a company pays to be on the map with a unique icon or label. The billboard-like advertisements are blocking our view of the basemap! We are glad that the nice San Francisco landmarks are not covered up at the top. By the way, maps like this are still being made today, search for Silicon Valley Map to find more from the same company.
A map called Silicon Valley in 1982 has a similar perspective and is also a pictorial so we wonder how it relates to this and if it was an inspiration for it. There was definitely social commentary associated with the Silicon Valley in 1982 map so we wonder whether this one might have an element of that as well. There are a lot of nods to the technology and science industries, more landmarks, a budget sign tied to a rock near the bay, and maybe a reference to Berkeley being off in the distance, though we aren’t completely sure. Diversity in the technology industry, or rather, its lack of it, is brought up here. Are companies today taking diversity seriously? Were they then?
TAM Cargo Series
“Anything to Anywhere” is the...
Previous Episode
Three Food Maps
Links
This Porcineograph [1:45]
Farmers Markets: Accessible to All? From Food: An Atlas [22:40]
Les Grands Vins de Bourgogne [35:20]
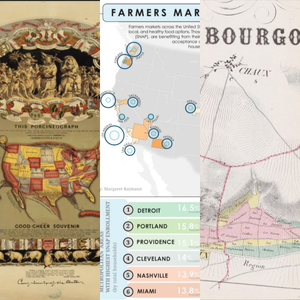
This Porcineograph
This is a weird one. As a fan of weird art, Vanessa’s first impression was that this map is pretty cool, weird, and creepy, and that it would go well in an Orwelian universe. This map is the United States, but as a pig. Yes, that’s right. The word “gehography,” possibly the best geographic pun ever, is used in the sub-title text and gives a sense of the humor that went into it. Aesthetically, we’re looking at a lithograph and this is shown by the level of detail and the way that different textures and colors stop in clear and straight lines. It was commissioned by an eccentric entrepreneur who had built a successful sewing machine company and then poured his money into a pig farm, the opening of which was being announced by way of this map poster. This map was made to announce the opening of his pig farm. This guy had a cause, which was to eradicate foodborne illnesses to make the food market of the 19th century safer with good animal husbandry. To kick things off he made 2,500 copies of this map for a party. It was a “good cheer souvenir,” as it calls itself.
This is a relatively accurate depiction of the United States except where it isn’t. For example, Florida is the front right leg of the pig, which seems to fit pretty well but the tail isn’t part of the country. What should we call maps that look like animals, of which this is just one of many others that could be placed in this genre? On twitter, Robert St. John suggested that they should be called mapaphores, which seems quite fitting.
Other highlights on this map include a hog pouring itself a drink, a reference to brain sauce, a dodo look-alike bird, and a pig eating shrimp. Forming the frame of the map is a ribbon for each state, a pig, and a reference to the state’s favorite pork dish. Colorado’s is something called roast chines, a kind of stuffed bacon apparently and an old dish imported from England. But returning to the main map, you see the utilization of Canada as a supporting feature that creates parts of the hog shape, such as parts of Canada represented as tufts of hair, but there are also parts of Canada that are intentionally maintained in their true geographic shape. The same goes for Mexico.
The state colors have a different color in each such that, for the most part, each state has a color that makes it look visually separated from its nearest neighbors. The Four Color Theorem, which states that a planar map of polygons only needs four colors such that no adjacent polygon has the same color, is an obvious cartographic factoid to bring up in relation to this. Upon closer scrutiny, however, we notice that the map maker has cleverly altered the color scheme to suit the purpose where color was needed to convey the idea of the country as a pig, such as Wisconsin and Michigan both being shades of red where they are supposed to form part of the pig’s ear. A discussion of mitten-shaped states ensues.
Farmers Markets: Accessible to All?
A free book called Food: An Atlas was put together by an organization called Guerrilla Cartography. This map, by Margaret Raimann, is one of the maps in the book. It’s on an important food topic in that it shows farmers’ market accessibility for those who are on the Supplemental Nutrition Assistance Program (SNAP), essentially showing us the proportion of farmer’s markets that accept SNAP in each metropolitan area of the U.S. It shows that there is a large disparity across the country. The circles that are used to show this were really effective in terms of instantaneous understanding of the data even for people who have never seen this kind of data presentation. The labels that curve along the circles of the metro areas are super unique, meaningful, and helpful. The curvy feel on the labels carries over throughout the map and the marginalia and lends to a cohesive look.
The grayscale basemap is notable for its ability to be pulled backward in the visual hierarchy. Pushing yourself cartographically by making grayscale maps is a good exercise. Daniel Huffman, in fact, hosted a monochrome mapping competition a couple of years ago, and its winners are good to look at for inspiration. Speaking of circles though, a lot of cartographic software makes it easy to create proportional circle symbols out of your data to show that there’s more here and less there but we caution that circle size can be difficult for the human eye to differentiate (Meihoefer, The Utility of the Circle as an Effective Cartographic Symbol, 1969). Howev...
If you like this episode you’ll love


Episode Comments
Generate a badge
Get a badge for your website that links back to this episode
<a href="https://goodpods.com/podcasts/urhere-426172/three-advertising-maps-58696152"> <img src="https://storage.googleapis.com/goodpods-images-bucket/badges/generic-badge-1.svg" alt="listen to three advertising maps on goodpods" style="width: 225px" /> </a>
Copy